
Start with debugging PHP code
Debugging your PHP code with Visual Studio Code editor and Xdebug

Hi Folks! I'm Roberto, and I'm DevRel. I like to learn and explore new things in software development in my spare time. I have many open-source side projects. I like to document and share my experiments via blogs, videos, and during conference talks (LaraconEU, LaravelDay, PHPday Grusp Edition, etc ...).
PHP has an excellent and mature ecosystem that also includes reliable and practical tools for improving the quality of one's code. Some "code quality" tools are for checking and correcting code to follow specific standards, others are useful for static code analysis, some for defining and executing test suites, and others for debugging the application.
In this article I'm going to show how to debug your PHP code in the Visual Studio Code editor, using Xdebug.
Debugging
Debugging refers to identifying, analyzing, and fixing software code errors, bugs, and issues. The primary goal of debugging is to eliminate errors and make the code run smoothly, efficiently, and as intended. Debugging helps and supports developers to ensure the quality, reliability, and security of the software they develop.
Debugging can be done statically (with Static Code Analysis Tool) by examining the code without executing the program or via code execution (with Debugger Tool) by examining and stepping through the code, setting breakpoints, inspecting variables, and tracking the execution flow.
In this article, I'm going to cover the scenario where you as a developer are using Visual Studio Code, PHP language and Xdebug as a debugging tool.
Installing Xdebug
First, you can check if Xdebug is already installed on your system by running php -m | grep xdebug in your terminal. If you see the output, it means Xdebug is already installed on your system. If Xdebug is installed you can check quickly the configuration parameters running: php -i | grep xdebug.
Otherwise, proceed to the next step with Xdebug installation.
You can install Xdebug using PECL (PHP Extension Community Library) by running the following command in your terminal: pecl install xdebug .
If you are using Debian GNU/Linux or Ubuntu GNU/Linux you can use apt with sudo apt-get install php-xdebug.
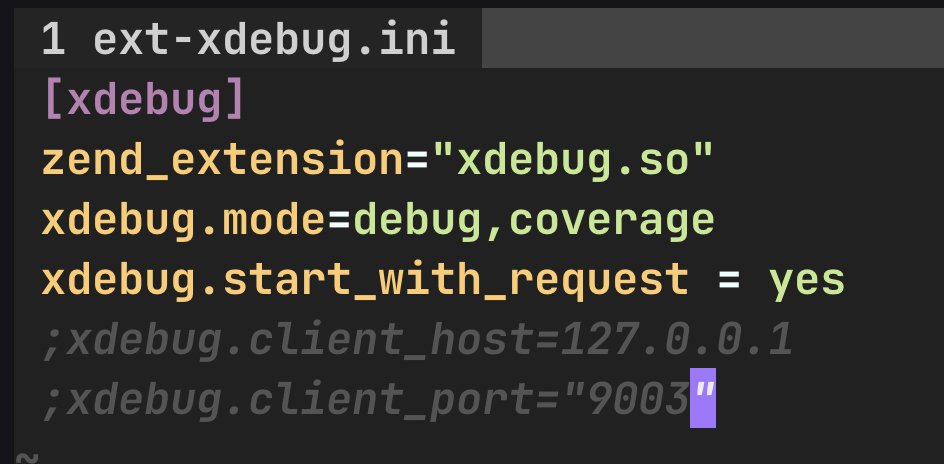
After installing Xdebug, you have to load the extension in your php.ini file: zend_extension="/path/to/xdebug.so" .
For example, if you are using Macos and homebrew with PHP 8.2 you can define the ext-xdebug.ini .
Enabling Xdebug in Visual Studio Code
Once you installed Xdebug, you can start to use it for debugging your PHP code.
If you are using Visual Studio Code as the code editor, you can install the Visual Studio Code extension:
Name: PHP Debug
Id: xdebug.php-debug
Description: Debug support for PHP with Xdebug
Version: 1.32.0
Publisher: Xdebug VS
Marketplace Link: https://marketplace.visualstudio.com/items?itemName=xdebug.php-debug
To install it, go to this URL: https://marketplace.visualstudio.com/items?itemName=xdebug.php-debug and click on the Install button.
Once you have installed the Visual Studio Code Extension, you can start to debug your script.
For example, you can open your VS code editor and create a new file, test.php:
<?php

$i = 2;
$j = 0;
$j = $i + 3;
if ($j === 5) {
    echo "FIVE";
}
echo $j;
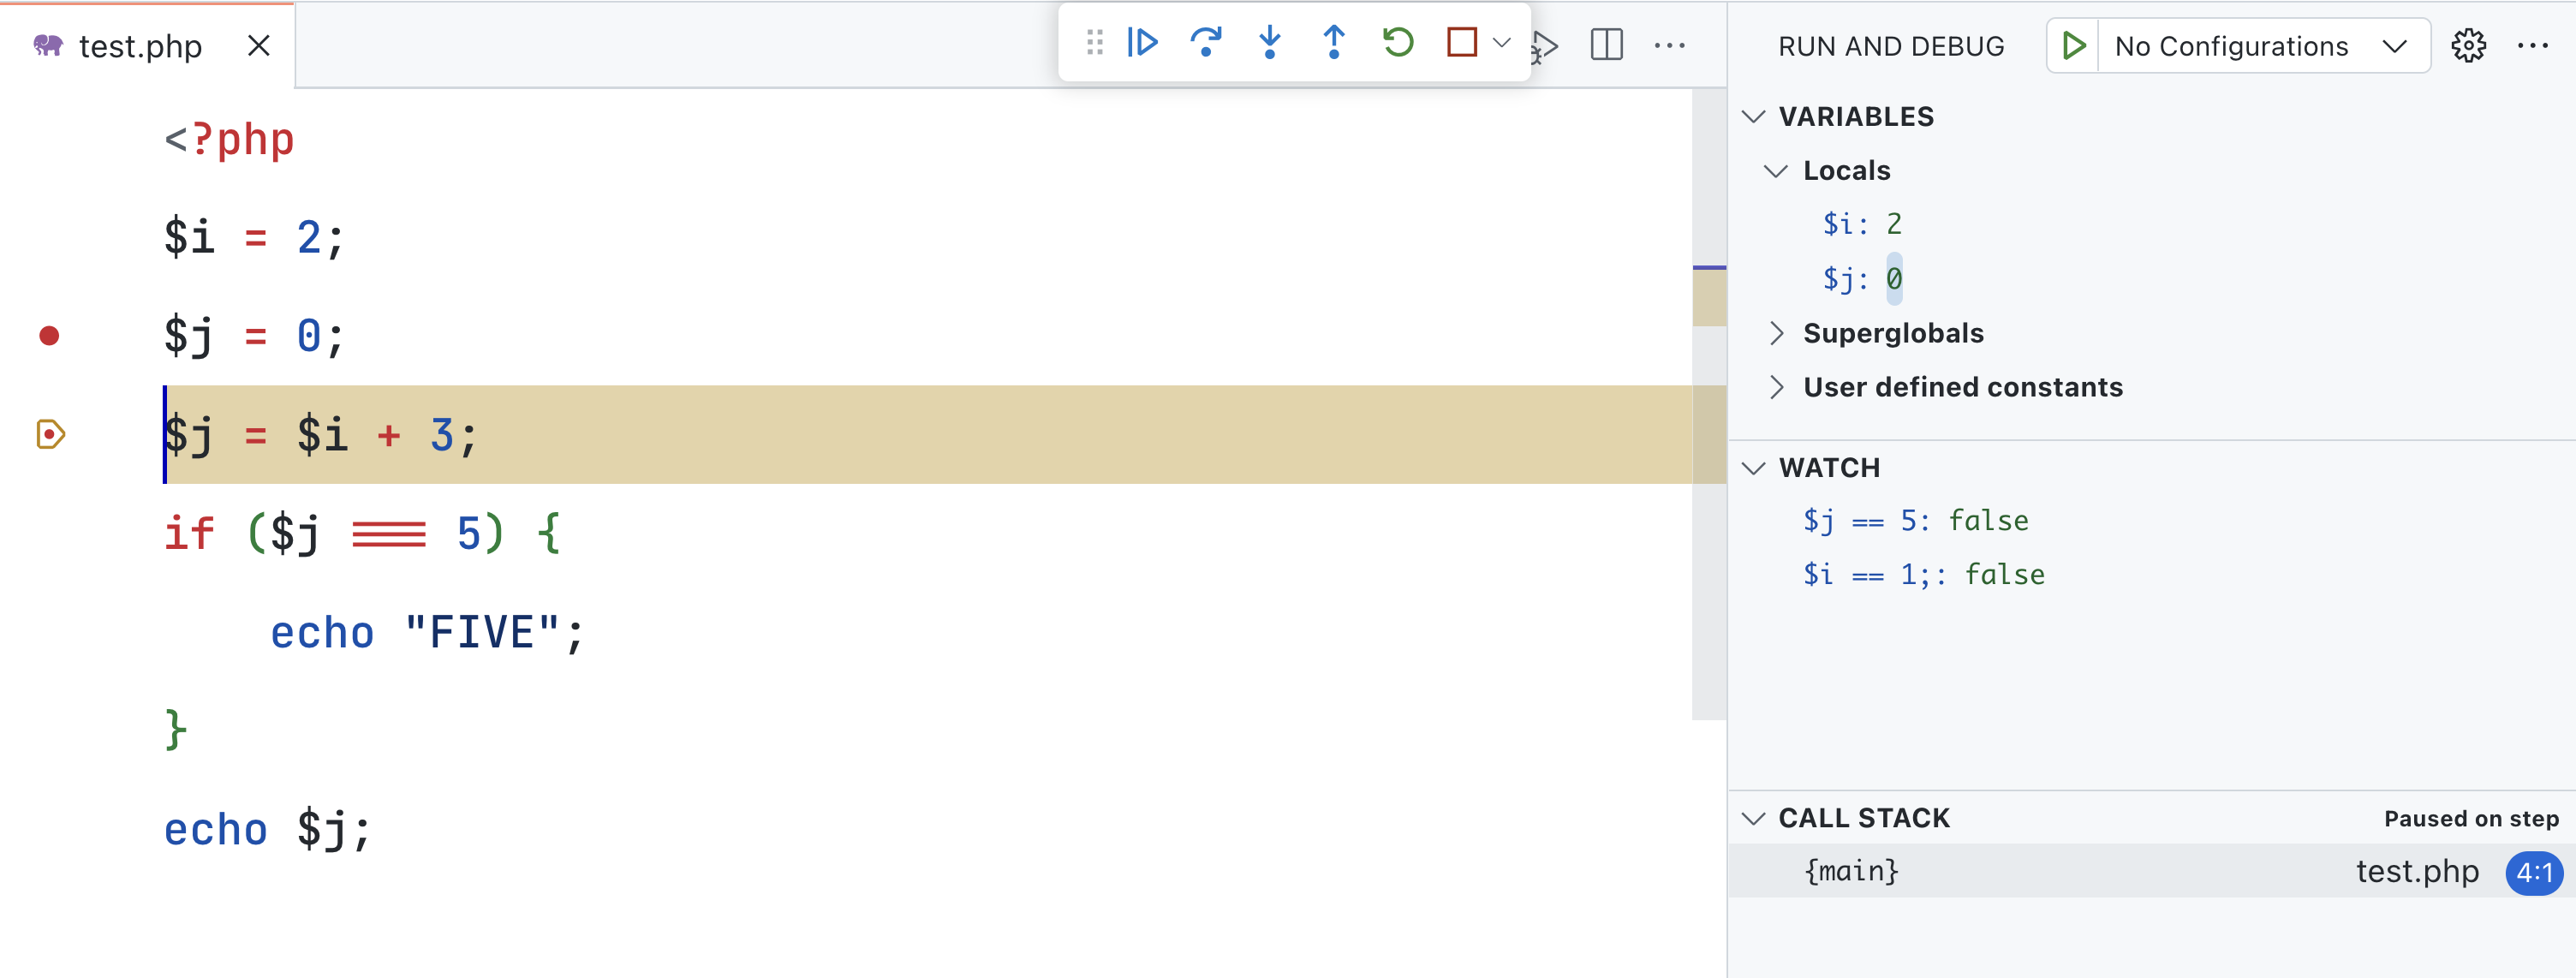
Before launching the debugging process, you can set a breakpoint. A breakpoint is a point in the source code where the execution of the PHP script can be paused for debugging purposes. For example, go to line 5, $j = $i + 3; and set the breakpoint in the Run menu and select Toggle Breakpoint.
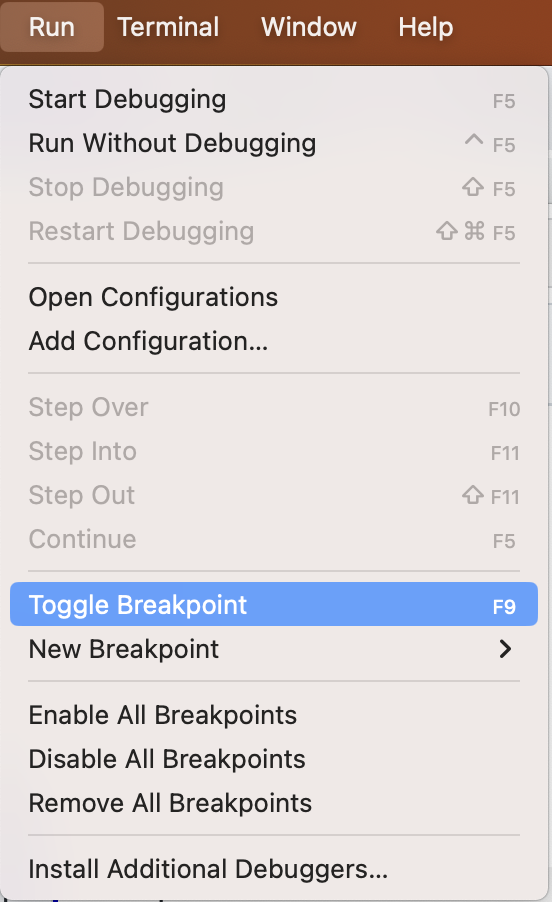
You have more than one way to set a breakpoint, you can use the F9 key function or clicking the left margin of the editor close to the line number.
Once the breakpoint is set, you can launch the debugging process.
On Run menu, select Start Debugging or press F5 key button on your keyboard.
To debug a script, make sure that Launch currently open in Run and Debug toolbox (1).
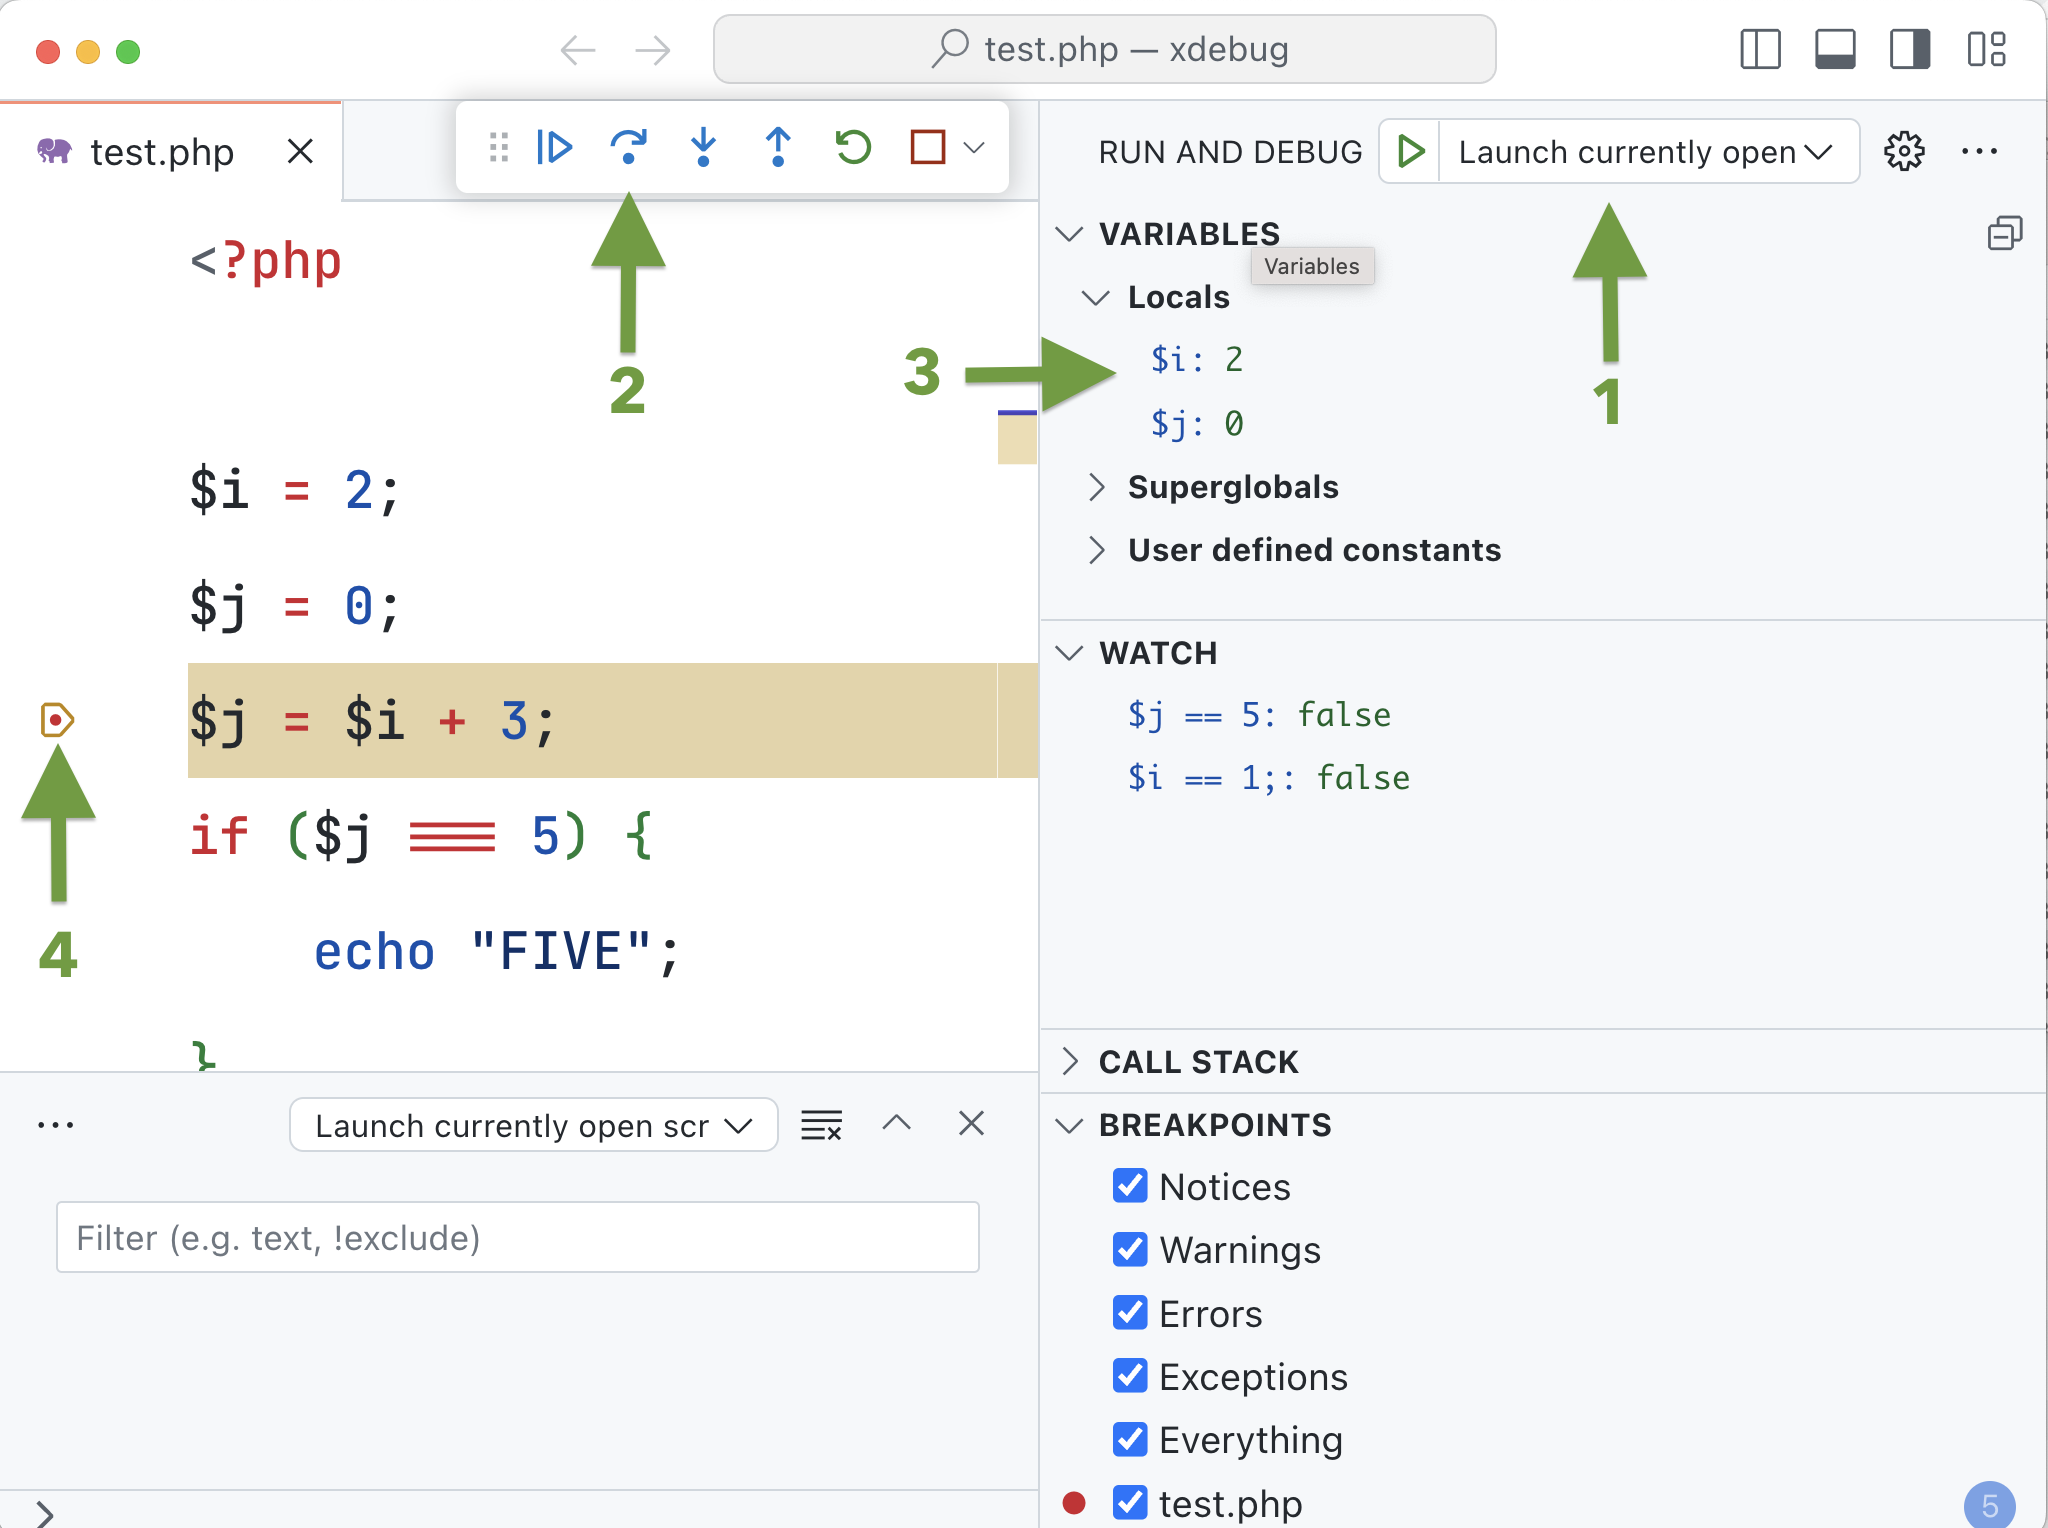
Once the execution hit the breakpoint (4), the execution flow is automatically paused, and you can inspect the value of the variables in the Variables -> Locals toolbox (3). To continue a step by step execution you can click the Step Over button (2) or pressing F10 function key of your keyboard.
You can set more than one breakpoint.
Setting a watch expression
A watch expression allows a programmer to monitor the value of a particular expression or variable while the program is running.
To set a watch expression you can click the + button in the WATCH section (1).
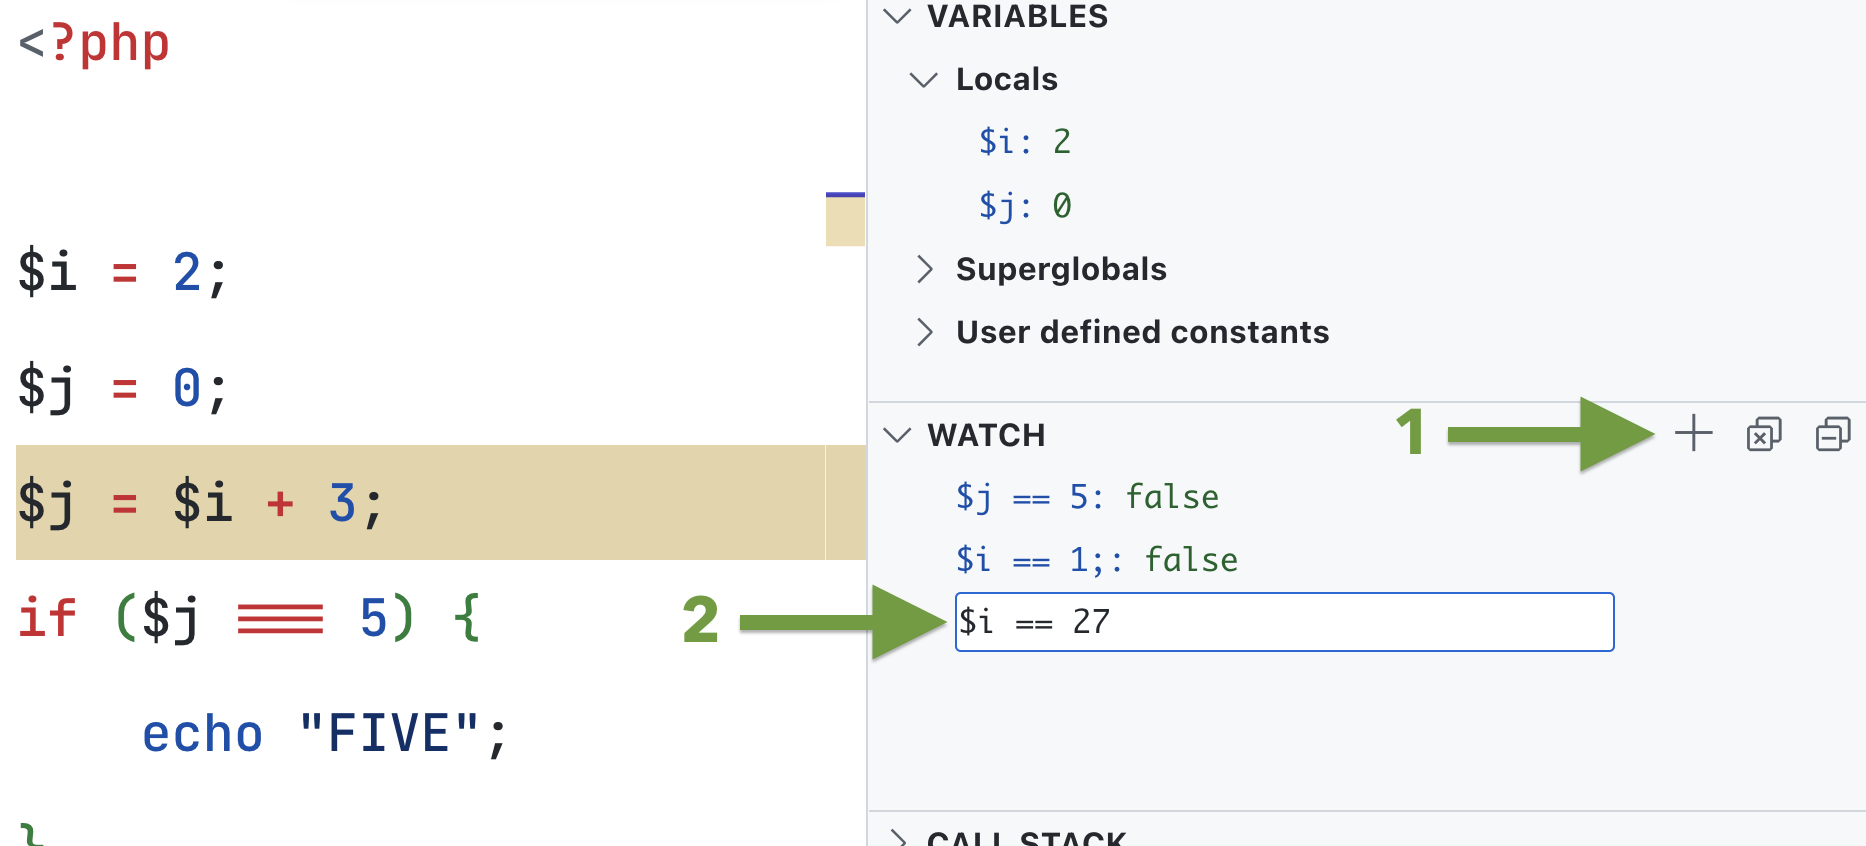
Then you can set an expression (2), for example, $i == 27. The expression will be evaluated during the execution of the instructions.
Setting a conditional breakpoint
A conditional breakpoint is set up to stop the program's execution only when a specified condition is true, rather than at a particular line of code.
A very example is when you have a loop, and you want to pause the execution only when the counter or a variable matches a specific value.
Or, if you want to stop at a specific point of your code only when a variable has a specific value because you want to debug that specific case.
For example, in the next code snippet, I want to set a breakpoint on the echo instruction, only when the value of the variable $i matches the value 9 (so in the latest loop iteration):
$i = 0;
while ($i < 10) {
    echo 'Value: '.$i.PHP_EOL;
    $i++;
}
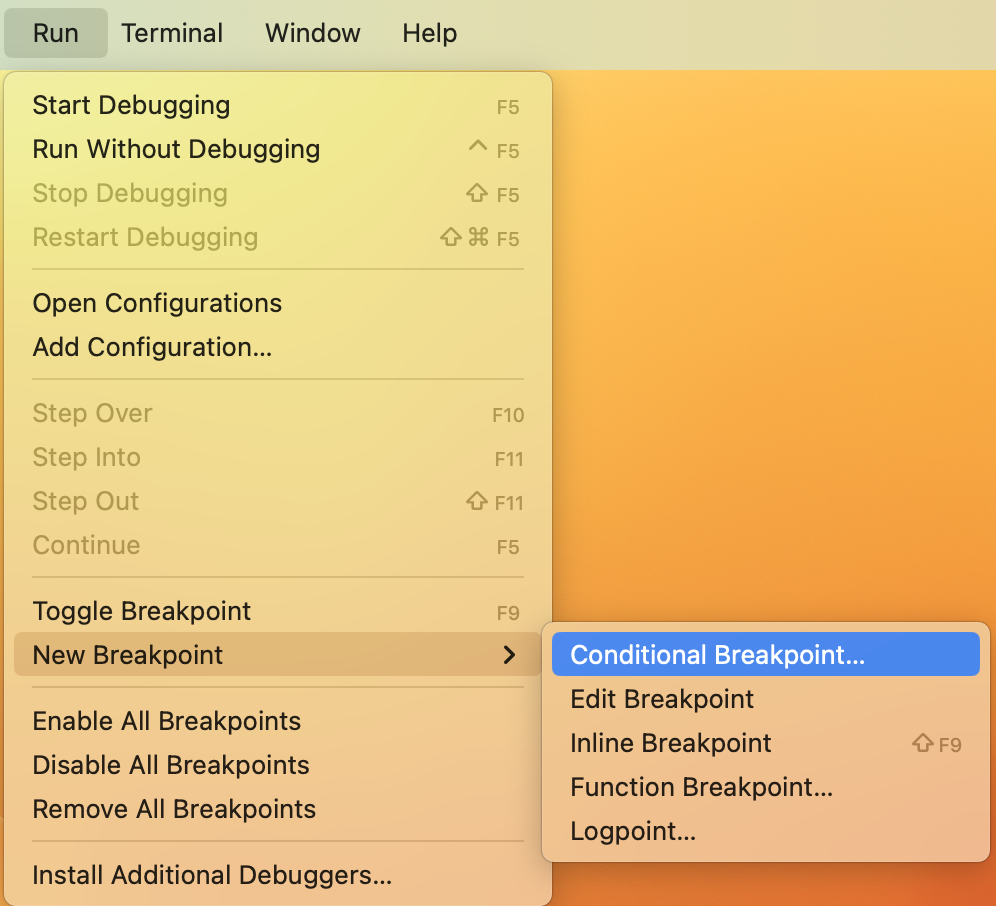
For setting up the conditional breakpoint, you have to go to the line where you want to set the breakpoint (for example the line with echo instruction), then in the Run menu, select New Breakpoint and then Conditional Breakpoint... .
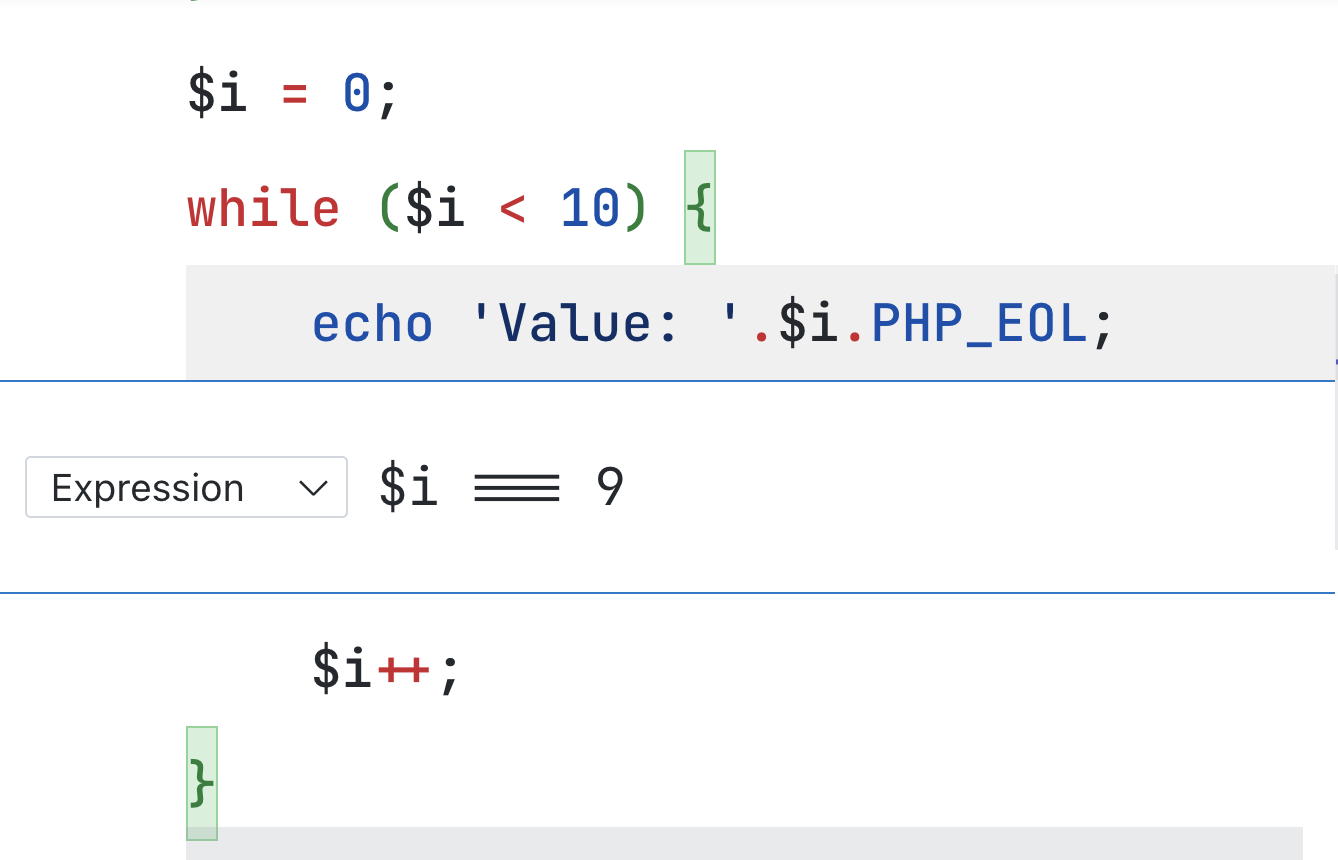
Now, in the overlay that appears on your line, you can set the expression for example $i === 9 for setting the breakpoint that stops the code execution only when the value of the variable $i matches the value 9. To confirm the expression and set the breakpoint, press enter key.
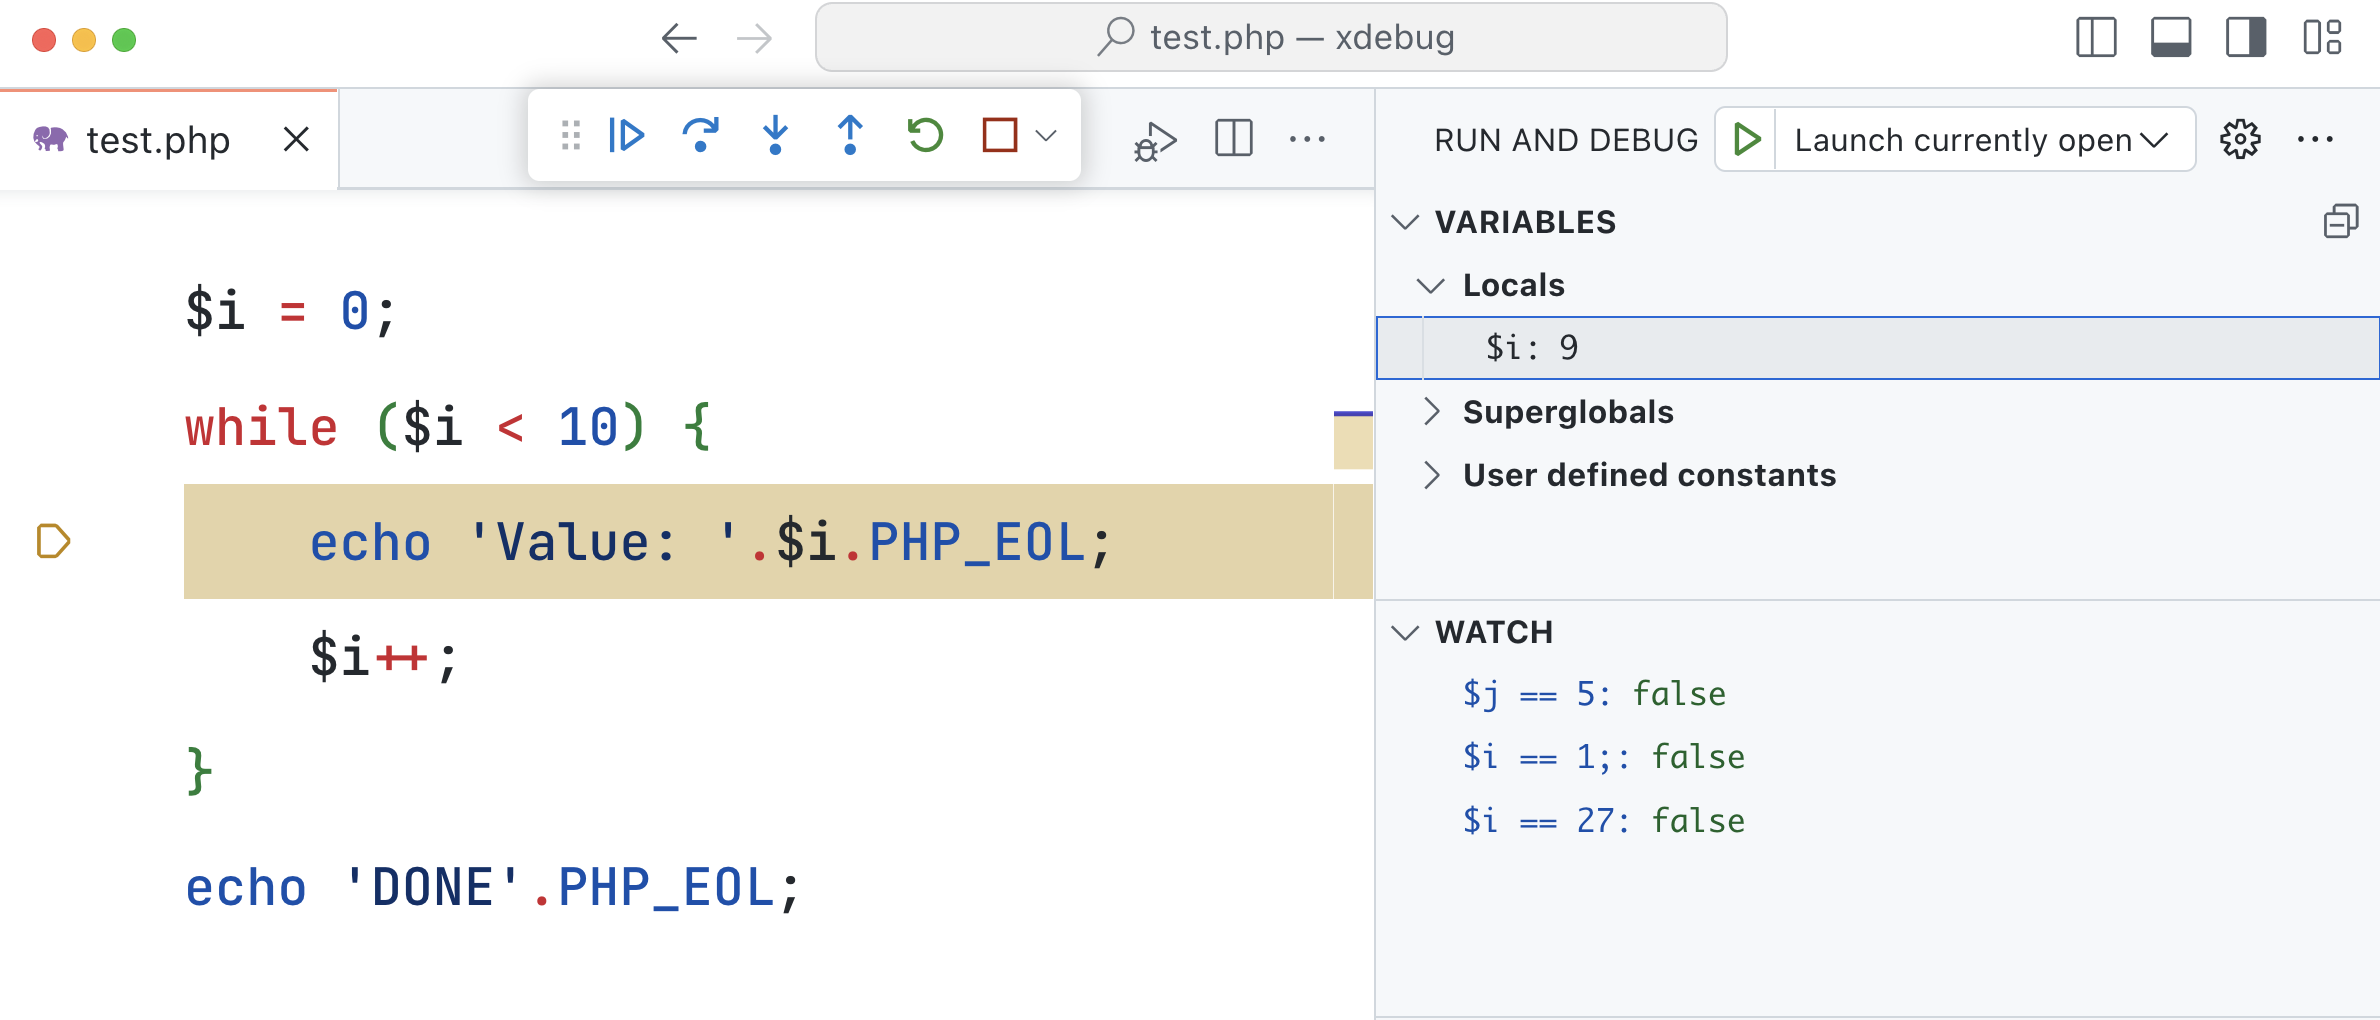
Now if you start your debugging with Run -> Start Debugging or simply pressing F5 key, you will see that the execution will stop at the line with the breakpoint and the value of the variable $i is equal to 9. You can see that also the watch expressions are evaluated.
Next steps
Once you have your editor set up with Xdebug you can start using the debugging process in your real projects.
My suggestion is to add Xdebug to your "code quality toolbox".
And another suggestion is, to make the debugging process easier, to add to your "code quality toolbox" two other powerful tools:
PHPstan for static code analysis;
PestPHP for writing and managing your PHP tests.
I will cover PHPstan, and PestPHP in the next article.
Feel free to leave any constructive feedback in the comments. After all, we are here to learn and try to improve every day. See you on social media: https://twitter.com/RmeetsH.
I submitted this article to the Debugging February challenge. Please let me hear your cheers in the comments or on Twitter.

